Building a PowerShell cmdlet using C# - Part 2: Debugging
On the previous article of the series, we created a Visual Studio project for a cmdlet and added the base code. This article is going to be about debugging the code, an ability that will greatly reduce the time taken to troubleshoot.
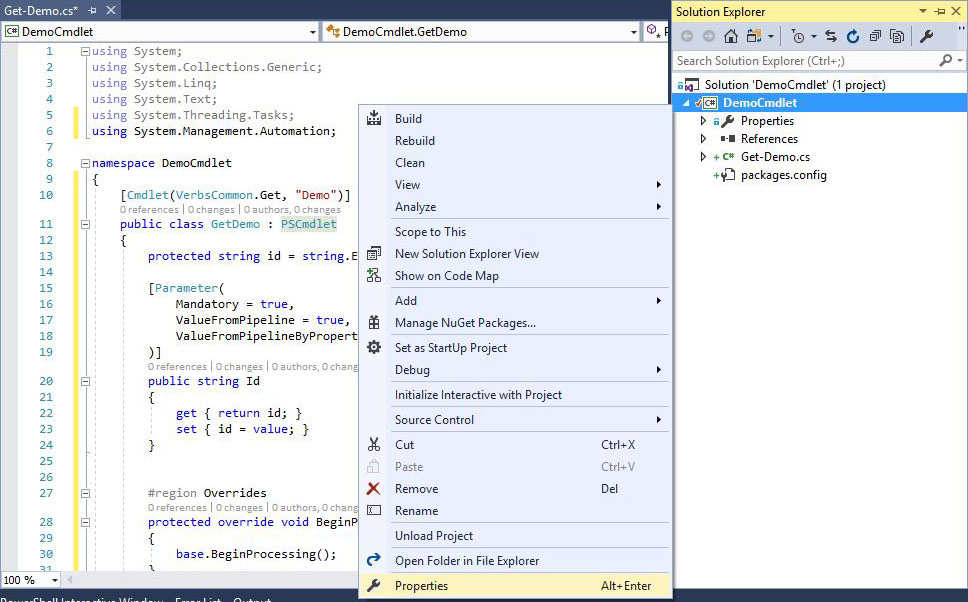
Right click your project and select "Properties". On the properties tab, click "Debug" to go to debug settings.
Here we are gong to select the "Start external program" option and browse to the powershell executable located at "C:\Windows\System32\WindowsPowerShell\v1.0\powershell.exe". This way, when we start the debugger, a PowerShell window will start.
We also want our module to be loaded to that PowerShell host so fill the following in the "Command line arguments" box: -noexit -command "&{ import-module .\DemoCmdlet.dll -verbose}"
Replace the name of the dll with the one created for your project. You can find it by browsing to the bin/Debug folder in your project.

When you hit "Start" to start debugging, a PowerShell window will appear and your module will be loaded:

Now that we have configured the debugging options, lets try to hit a breakpoint. Set a breakpoint in your ProcessRecord function and hit F5. When Powershell opens, try executing your cmdlet. The breakpoint should be hit and the execution paused:

This will allow you to examine the values of your variables and move through the code a statement at a time to check the logic.
While we're at it, lets take a quick look on the basic debugging controls. As you already know, the "Start" button starts the debugging process.
After you hit the start button, it will disappear and the "Continue" button will take it's place. When a breakpoint is hit, this button will be enabled and clicking it will resume the execution until the next breakpoint is hit or the session is over.
Apart from those two, there are also buttons to break the debug operation, stop it or restart it.
The last four buttons, can be used after a breakpoint is hit to execute the next statements manually without the need for more breakpoints to pause the execution.

Let's take the below code for example:

The "Step Over" button will execute the current statement and move to the next one. The statement on line 35 will be executed and the execution will be moved to line 37.
If the statement is a function, the "Step Into" button will move you to the next statement in the function. Note here that if you step over a function call, the next statement would be the one following the call and not the first statement in the function.
Let's say that the execution is at line 43. The step over button will pause the execution to line 44 at the end of the else block where the step into button will pause the execution at line 48, at the beginning of the function.
The "Step Out" button will continue the execution until it's passed the current function. If the execution was paused at line 49 for example, the step out button will pause the execution on line 43 where the assignment to the variable is the last step of the statement.
The "Show Next Statement" button will open the file were the next statement to be executed is defined.
There are many other cool features regarding debugging in Visual Studio, but I won't get into more details since those apply to all types of projects and finding more information on them won't be difficult.
On the next article we are going to take a look at the functions to write to the output streams like Verbose, Error, Warning and Ouput.
Right click your project and select "Properties". On the properties tab, click "Debug" to go to debug settings.
Here we are gong to select the "Start external program" option and browse to the powershell executable located at "C:\Windows\System32\WindowsPowerShell\v1.0\powershell.exe". This way, when we start the debugger, a PowerShell window will start.
We also want our module to be loaded to that PowerShell host so fill the following in the "Command line arguments" box: -noexit -command "&{ import-module .\DemoCmdlet.dll -verbose}"
Replace the name of the dll with the one created for your project. You can find it by browsing to the bin/Debug folder in your project.
When you hit "Start" to start debugging, a PowerShell window will appear and your module will be loaded:
Now that we have configured the debugging options, lets try to hit a breakpoint. Set a breakpoint in your ProcessRecord function and hit F5. When Powershell opens, try executing your cmdlet. The breakpoint should be hit and the execution paused:
This will allow you to examine the values of your variables and move through the code a statement at a time to check the logic.
While we're at it, lets take a quick look on the basic debugging controls. As you already know, the "Start" button starts the debugging process.
After you hit the start button, it will disappear and the "Continue" button will take it's place. When a breakpoint is hit, this button will be enabled and clicking it will resume the execution until the next breakpoint is hit or the session is over.
Apart from those two, there are also buttons to break the debug operation, stop it or restart it.
The last four buttons, can be used after a breakpoint is hit to execute the next statements manually without the need for more breakpoints to pause the execution.
Let's take the below code for example:
The "Step Over" button will execute the current statement and move to the next one. The statement on line 35 will be executed and the execution will be moved to line 37.
If the statement is a function, the "Step Into" button will move you to the next statement in the function. Note here that if you step over a function call, the next statement would be the one following the call and not the first statement in the function.
Let's say that the execution is at line 43. The step over button will pause the execution to line 44 at the end of the else block where the step into button will pause the execution at line 48, at the beginning of the function.
The "Step Out" button will continue the execution until it's passed the current function. If the execution was paused at line 49 for example, the step out button will pause the execution on line 43 where the assignment to the variable is the last step of the statement.
The "Show Next Statement" button will open the file were the next statement to be executed is defined.
There are many other cool features regarding debugging in Visual Studio, but I won't get into more details since those apply to all types of projects and finding more information on them won't be difficult.
On the next article we are going to take a look at the functions to write to the output streams like Verbose, Error, Warning and Ouput.