Querying OMS for Performance Data
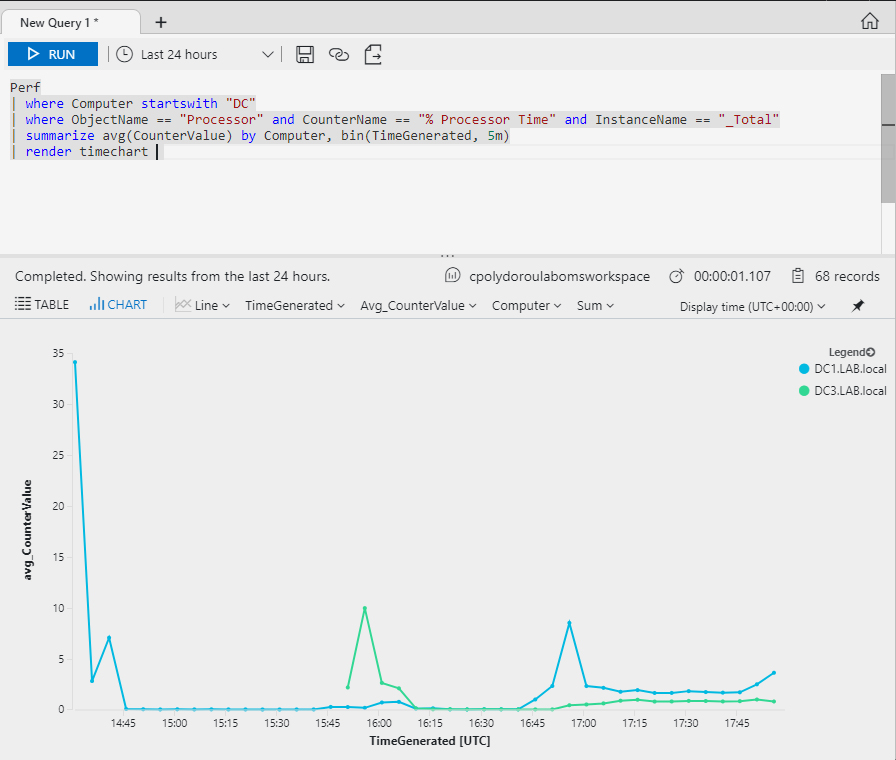
On the previous articles of the OMS series, we configured the workspace and installed the agents on the machines. It's time to start examining the data accumulated on the workspace and create reports, diagrams and alerts. On this article we are going to create diagrams that show the system performance statistics of the servers. Let's start with a query that will display the total CPU utilization. We are querying the performance data produced by servers that their name starts with "DC" in order to get data related to the domain controllers. I would like to take a moment here and focus on the importance of the naming conventions. Having proper names for your machines is very important when in comes to OMS since the computer name is the easiest way to relate the data to the machine. On the third line of the query, we specify that we like to have the data for the "% Processor Time" counter and the "_Total" instance of the "Processor...