Posts

Showing posts with the label OMS

Monitoring Azure Activity Log using OMS
Image
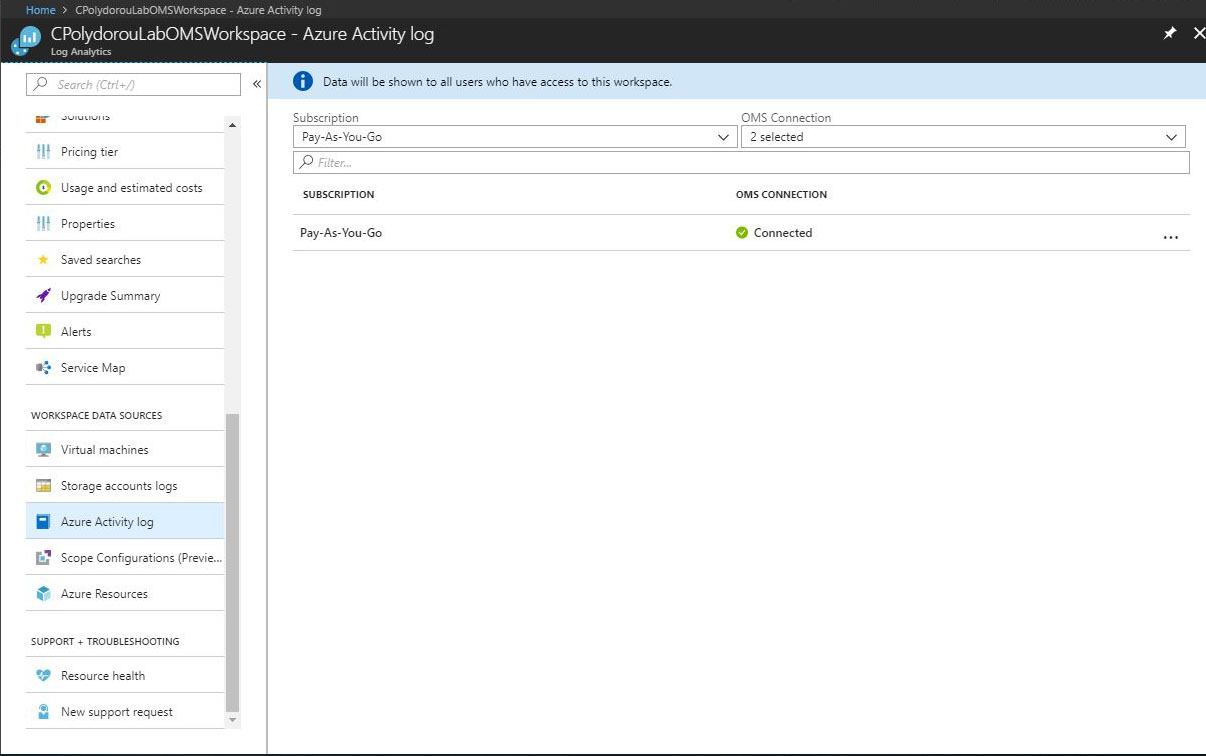
Although Azure OMS is a great tool to collect and analyse logs and counters from various kinds of systems, it's functionality is not limited to these. Recently, the ability to log the activity of your Azure subscription, such as resource creation and removal and delegation actions was added to OMS. To get such information logged in OMS, you have to connect your subscription to the workspace. Navigate the the workspace blade and select "Azure Activity Log" under "Workspace Data Sources". The subscription is connected, so let's take the creation of a virtual machine for example. The below query for activity log regarding the resource group "BlogVirtualMachines" brings back a lot of results related to the deployment, the storage account, the networking components, the virtual machine and many others within that resource group. Let's expand a few to see the information inside. The "Create Deployment" record shows that a depl...
Monitoring Microsoft SQL using OMS

Image
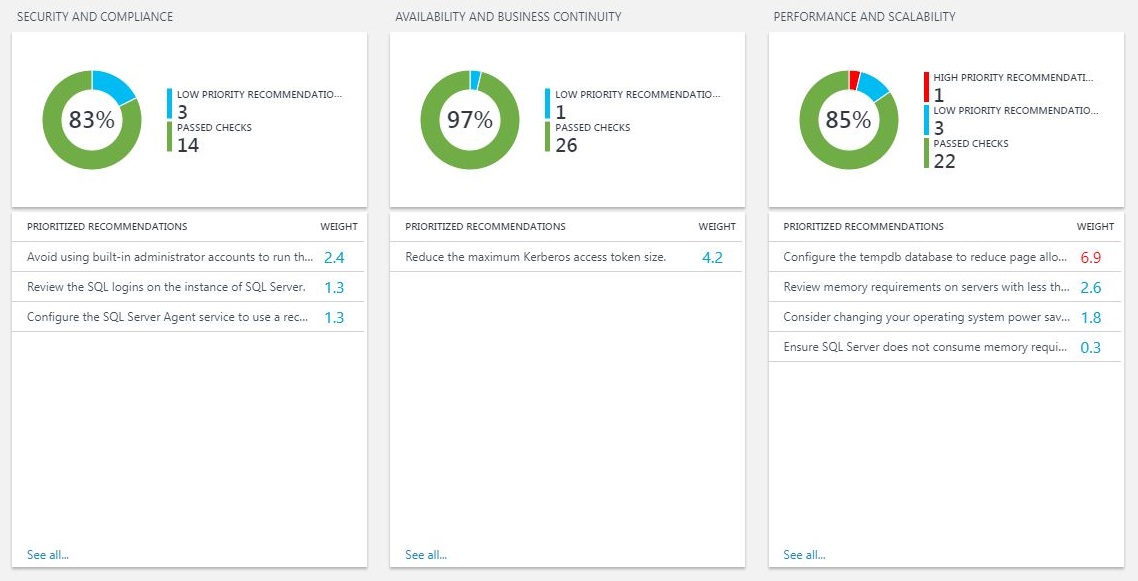
Moving on to the next article about Microsoft Operations Manager Suite, we're going to take a look on a solution for Microsoft SQL servers. The SQL Health Check solution will provide useful information about the status of your SQL servers regarding security, compliance, availability, performance and many other aspects. As you may see below, I have a lot of recommendations for my lab servers, including the accounts used by the SQL services, the performance of the tempdb and even the power settings on the servers! Two of the below stand out, the suggestion to check the logins on the servers - since they are members of an availability group and missing logins can cause application downtime and the suggestion to limit the memory of the SQL server in order to avoid consuming memory needed by the operating system. The solution also provides information about the upgrade and migration status, change management and operations and monitoring. Here, I'm warned that R...

Assessing Security using OMS

Image
Having all this information such as application and security logs, installed updates and anti malware status on OMS, gives you the perfect opportunity to assess the security status of your organization and reduce your risk surface. Fortunately, you don't have to write the queries yourself - although you could - since solutions that can produce security reports are just a few clicks away. The "Security and Audit" solution performs multiple checks regarding update and anti malware status, applied security settings and even failed logon attempts. Below is a sample of the report: The "Antimalware Assessment" solution is all about the health of your machines. It provides status reports, the threats that have been detected and the unprotected machines. The above solutions, when combined, provide a full and detailed view on your organization's security status and give you the ability to tighten your overall security and discover trends and issues. ...

Monitoring Active Directory Health using OMS

Image
Following the last OMS article about the update management solution, I would like to show you two more, this time about Active Directory. The Active Directory Health Check solution provides information on many aspects of your Active Directory environment such as Security, Compliance, Business Continuity and Performance. Each group performs a number of checks against the logs, to find possible issues. Good news, apart from the backup issue, my AD is looking great!!! The second solution I'm using for Active Directory is AD Replication Status. It examines the domain controller logs and provides useful insights on the health of the replication of your Active Directory environment. I've left the DC4 domain controller on my lab disconnected from the network on purpose in order to create replication issues. Replication between DC3 and DC4 is broken, since the servers hadn't communicated for a while. Those two solutions can save you from a lot...

Update Management using OMS

Image
Writing your own queries for OMS is great, it gives you the flexibility to get the data in the exact form you want it and full control over the data to return, not to mention the ability to create an alert using the very same query.  There are however solutions that can be added to your workspace that already have logic and display reports in form of charts or lists. Adding a solution is a matter of seconds, although may of them require and automation account (that's pretty straight forward, don't worry!). You just have to browse the solution gallery from the OMS portal and hit the add button. The first solution I've added to my workspace was Update Management. This solution provides statistics about the update status of your Windows and Linux computers. The first two charts display information about the Windows and Linux computers that have been assessed: The information here is scoped to the computer level as opposed to the next two that show statisti...

Generating Alerts On OMS

Image
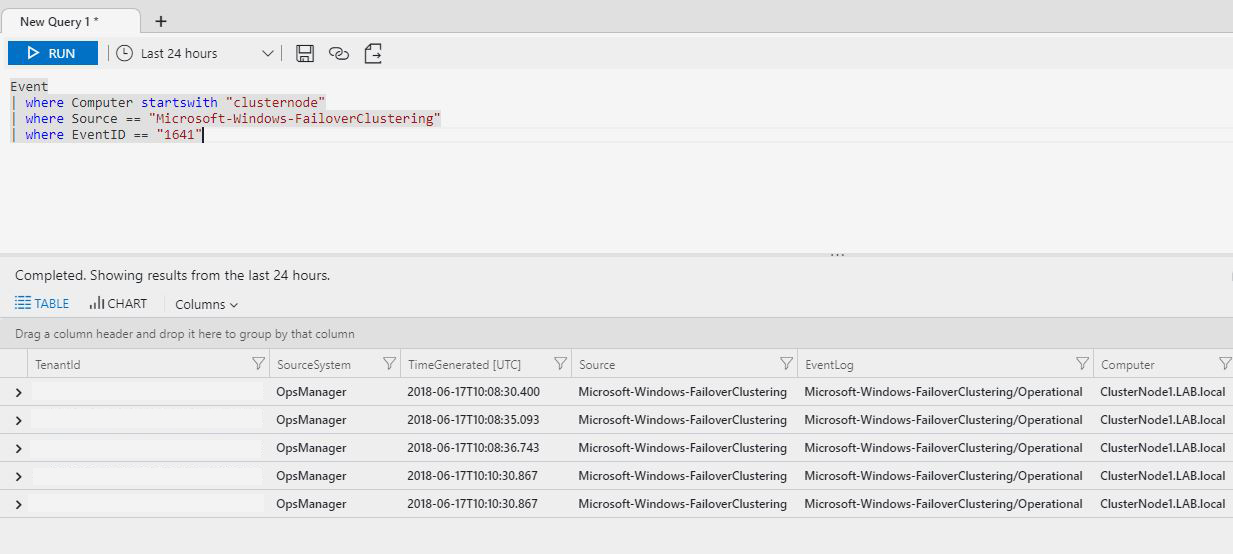
On the previous articles about Microsoft OMS, we've configured event and log collection from various systems and we've queried the workspace for information. We have the information, wouldn't it be great if we could also act on it? The Operations Management Suite has a feature named "Alerts" that provides this functionality. Creating alerts is a straight forward and only takes a few minutes. To illustrate the process, we are going to configure an alert for a Windows Server Failover Cluster that hosts the File Server role. When a cluster resource is moving to another node of the cluster, an event with id 1641 is generated under the source "FaileoverClustering" of the log "Microsoft-Windows-FailoverClustering/Operational". To create the alert, we are going to need a query that returns the above events: Let's create the alert. From the main OMS blade, select "Alerts" and then "Create New Rule": This will bri...

Syslog Message Collection for OMS from sources that do not support the agent

Image
On the previous article of the OMS series, we've installed and configured the OMS agent on a linux machine and started collecting syslog messages and performance statistics. Today, we are going to use that machine to collect syslog messages from other machines, devices or applications that are not supported by the OMS agent. This is a two step process, first we are going to enable the remote syslog collection on the linux machine and then we are going to update the configuration of the agent to support high volume of syslog traffic. Let's dive in! The syslog server is going to be rsyslog since it came with Ubuntu server and the configuration file is stored at /etc/rsyslog.conf . To enable the remote collection, the below lines have to be uncommented in the configuration file:     module(load="imudp")     input(type="imudp" port="514") and     module(load="imtcp")     input(type="imtcp" port="514") Since w...

Install and Configure the OMS Linux Agent

Image
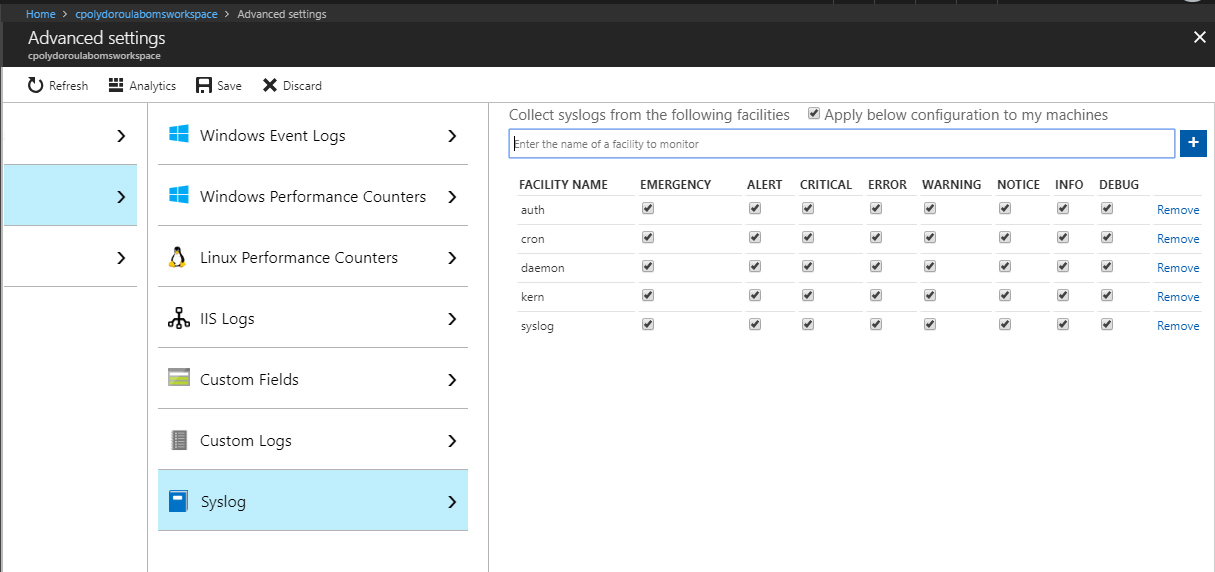
Welcome to another article of the Azure OMS series. This time we are going to configure the OMS workspace for syslog message and linux performance counter collection and then install the OMS agent on a linux machine. Before we start configuring the syslog machines, we have to enable syslog log collection on the OMS Workspace. Go to the "Data" blade of the "Advanced Settings" and select the "Syslog" option. There, you should enable the "Apply below configuration to my machines" option" and then add the syslog facilities to collect messages from. Since we're installing the agent on a linux machine, why not enable the collection of performance counters as well? Go to the "Linux Performance Counters" option of the "Data" blade and enable the "Apply below configuration to my machines" option. Then, add the performance counters to collect. Don't forget to click the save button to save the configura...

Collecting IIS log files on OMS

Image
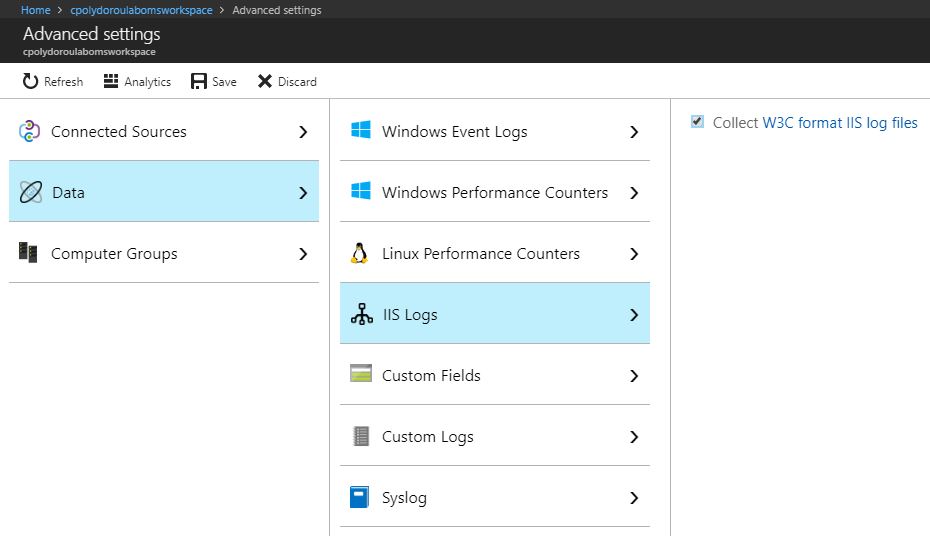
Moving on to the next article about Azure OMS, we'll start collecting IIS log files in order to be able to examine the requests and report on website usage. In order to start collecting IIS logs, we first have to enable the feature on the workspace. Don't forget to click save after enabling the setting. Give it some time and the agents should pickup the change and start uploading the logs. Moving on to the query part, I'm going to use my Exchange servers again, since they have websites that I would like to get statistics for. First, we'll summarize the requests per website: Then, we will extract statistics regarding the user agents used: Finally, we'll extract the number of requests on each Exchange virtual directory: I should mention here that the IIS log files have to be stored in W3C format and custom fields or IIS Advanced Logging are not supported at this time. Have fun! Related articles      Introduction to Azure Advanced Analyti...

Querying OMS for Events

Image
On the previous article of the series, we queried the OMS workspace for performance statistics and created graphs to present the data. On this article we are going to query for events on the windows logs. The below query will return all the servers that were shut down unexpectedly during the last day: The "project" function allows us to pick the columns on the result. Role fail over in failover clusters is another thing I usually monitor: Since the events are written in the Microsoft-Windows-FailoverClustering/Operational log, we need to add it to the windows event logs that OMS is collecting first. You can also monitor trends in application events: As show in the above chart, there number of error events in the application log of one of my Exchange servers increased significantly a few days ago. Data can also be rendered in multiple dimensions. The below graph shows the number of the Error, Warning, Information and Success events for the last day, per...

Querying OMS for Performance Data

Image
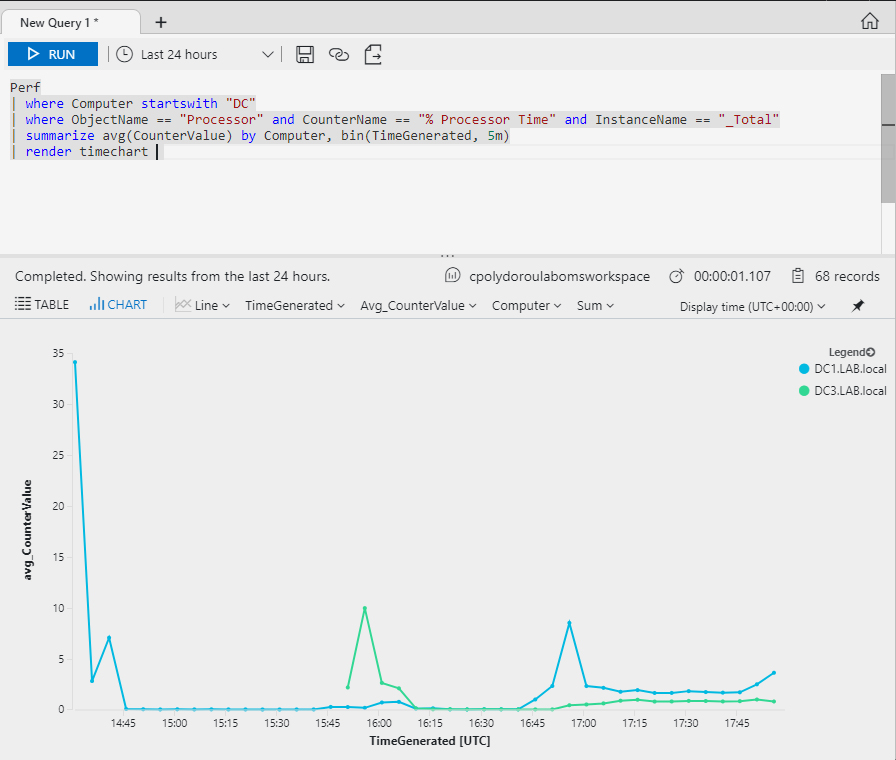
On the previous articles of the OMS series, we configured the workspace and installed the agents on the machines. It's time to start examining the data accumulated on the workspace and create reports, diagrams and alerts. On this article we are going to create diagrams that show the system performance statistics of the servers. Let's start with a query that will display the total CPU utilization. We are querying the performance data produced by servers that their name starts with "DC" in order to get data related to the domain controllers. I would like to take a moment here and focus on the importance of the naming conventions. Having proper names for your machines is very important when in comes to OMS since the computer name is the easiest way to relate the data to the machine. On the third line of the query, we specify that we like to have the data for the "% Processor Time" counter and the "_Total" instance of the "Processor...

Deploying the OMS Windows Agent using DSC

On this article we are going to deploy the OMS windows agent on a server using DSC. Before proceeding with the DSC part, there are some requirements that have to be met. We need to store the agent file on a file share that is going to be accessible by the server and we need to know the product id of the agent software in order to use it with the package resource. On my lab environment, I've configured a FreeNAS virtual machine to provide all kinds of file shares and I'm using a public SMB share to host the agent installation file. You can host it on any other location such as web, as long as there's a way to get it using DSC. I've also configured a DSC Pull server and I'm publishing the configurations there, but since it does not contain any custom configurations, you can publish it directly to the machines. An easy way to get it is to install the agent on a computer and then execute the following PowerShell command: PS C:\> Get-WmiObject Win32_Produc...