Querying OMS for Performance Data
On the previous articles of the OMS series, we configured the workspace and installed the agents on the machines. It's time to start examining the data accumulated on the workspace and create reports, diagrams and alerts.
On this article we are going to create diagrams that show the system performance statistics of the servers.
Let's start with a query that will display the total CPU utilization.
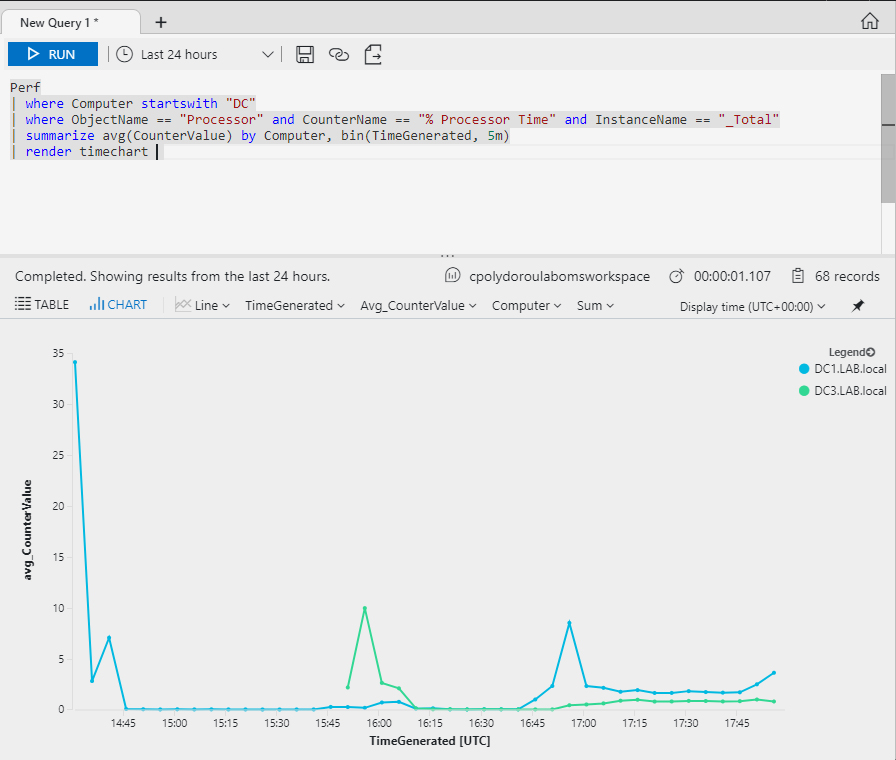
We are querying the performance data produced by servers that their name starts with "DC" in order to get data related to the domain controllers.
I would like to take a moment here and focus on the importance of the naming conventions. Having proper names for your machines is very important when in comes to OMS since the computer name is the easiest way to relate the data to the machine.
On the third line of the query, we specify that we like to have the data for the "% Processor Time" counter and the "_Total" instance of the "Processor" object.
Then we summarize the average counter value, by the name of the computer in bins of five minutes using the time that the sample was generated as reference. The result of the query is then rendered on a time chart.
Now a query that's a bit more complex! A report on the free space of my Exchange servers.

This time, we are using a regular expression to filter the computer name, but the interesting part is the summarize command. Each of my servers has two disks attached and we have to report the free space for both of them. Using the strcat command we create a string using the name of the computer and the name of the disk. This allows for differentiation between the disks of each server, as shown on the legend on the right.
Another important property of each record is the "TimeGenerated". You can use it to filter the data on the workspace by time. My favorite charts are the ones that display data from the last couple of days, since they provide the ability to compare the current state of a system or service to it's state the last day. This is very helpful when performing changes, that may affect the performance of the system of the applications on it. Let's take a look on an example.

The chart here shows the available megabytes of memory for a domain controller during the last two days. The "ago" scalar function subtracts the given timespan from the current UTC clock time.
If you have some other performance counters that you'd like to monitor, you have to configure the workspace accordingly.
More details on the Log Analytics language are available on the documentation page.
Related articles
Introduction to Azure Advanced Analytics
Configuring Log and Performance Counter collection on the OMS Workspace
Install and Configure the OMS Windows Agent
Verify the Agent Connectivity to OMS Workspace
Deploying the OMS Windows Agent using DSC
Querying OMS for Performance Data
Querying OMS for Events
Collecting IIS Log Files
Install and Configure the OMS Linux Agent
Syslog Message Collection for OMS from sources that do not support the agent
Generating Alerts on OMS
Update Management using OMS
Monitoring Active Directory Health using OMS
Assessing Security using OMS
Monitoring Microsoft SQL using OMS
Monitoring Azure Activity Log using OMS
On this article we are going to create diagrams that show the system performance statistics of the servers.
Let's start with a query that will display the total CPU utilization.
We are querying the performance data produced by servers that their name starts with "DC" in order to get data related to the domain controllers.
I would like to take a moment here and focus on the importance of the naming conventions. Having proper names for your machines is very important when in comes to OMS since the computer name is the easiest way to relate the data to the machine.
On the third line of the query, we specify that we like to have the data for the "% Processor Time" counter and the "_Total" instance of the "Processor" object.
Then we summarize the average counter value, by the name of the computer in bins of five minutes using the time that the sample was generated as reference. The result of the query is then rendered on a time chart.
Now a query that's a bit more complex! A report on the free space of my Exchange servers.
This time, we are using a regular expression to filter the computer name, but the interesting part is the summarize command. Each of my servers has two disks attached and we have to report the free space for both of them. Using the strcat command we create a string using the name of the computer and the name of the disk. This allows for differentiation between the disks of each server, as shown on the legend on the right.
Another important property of each record is the "TimeGenerated". You can use it to filter the data on the workspace by time. My favorite charts are the ones that display data from the last couple of days, since they provide the ability to compare the current state of a system or service to it's state the last day. This is very helpful when performing changes, that may affect the performance of the system of the applications on it. Let's take a look on an example.
The chart here shows the available megabytes of memory for a domain controller during the last two days. The "ago" scalar function subtracts the given timespan from the current UTC clock time.
If you have some other performance counters that you'd like to monitor, you have to configure the workspace accordingly.
More details on the Log Analytics language are available on the documentation page.
Related articles
Introduction to Azure Advanced Analytics
Configuring Log and Performance Counter collection on the OMS Workspace
Install and Configure the OMS Windows Agent
Verify the Agent Connectivity to OMS Workspace
Deploying the OMS Windows Agent using DSC
Querying OMS for Performance Data
Querying OMS for Events
Collecting IIS Log Files
Install and Configure the OMS Linux Agent
Syslog Message Collection for OMS from sources that do not support the agent
Generating Alerts on OMS
Update Management using OMS
Monitoring Active Directory Health using OMS
Assessing Security using OMS
Monitoring Microsoft SQL using OMS
Monitoring Azure Activity Log using OMS